2.1.1. Kuznets and the Natural Decrease of Income Inequality
Kuznets (1953) pioneered the development of empirical studies based on the income tax data sorted by income ranges, which is a common way to highlight income differences. Kuznets used individual income tax returns to derive top income shares series (top 1%, top 3%, top 5% and their intermediate percentage bands) from 1913 to 1948, but the series is fairly complete only for 1919-1946. In percent, the shares of upper income groups are defined as the ratio of income amounts reported by each group over total income. Individual tax returns, despite the term ‘individual’, do not necessarily reflect the income of individuals, rather the income of households filing a tax return. For consistency purposes, Kuznets decided to estimate series based on individuals, not tax units. To do so, Kuznets divided the total income reported in each income bracket by the total number of individuals represented by all tax returns in that bracket. For instance, a tax return of a widow with no dependents reporting $10,000 would be replaced by an individual with $10,000 of income while a family of four with $10,000 of income would be replaced by four identical individuals with $2,500 of income each. 4
Kuznets (1953) was restricted to the top tail of the distribution because taxes were paid only by the upper income classes of the population. Another data limitation is that the size of income shares depends upon the unit used in the distribution (individual, family, consuming unit, etc.) Under these circumstances, Kuznets (1953, p. xxxv) made at least three major findings: 1) The income shares of upper income groups drastically declined between 1939 and 1950; 2) this decline was highly correlated with the drop in the shares of upper income groups in total savings of individuals; and 3) short term changes in these shares were associated with business cycles.
Note that the declining trend of upper shares, in the U.S. at that time, serves as a prelude to the famous inverted-U curve.
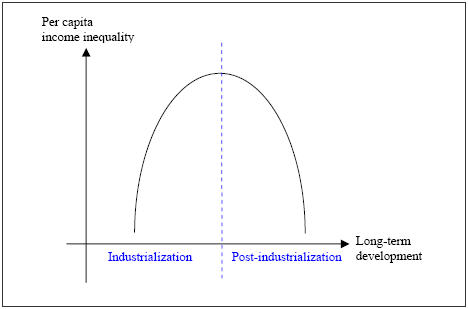
What follows briefly explains what the Kuznets’ curve is. Using the long-term perspective of development stages, Kuznets (1955) uses the partitioning of employment (among the usual three sectors of agriculture, manufacturing, and services activities) in order to explain how the development process first widens and then narrows income inequalities over time. Theoretically, as the industrial revolution triggers labor to migrate from rural areas to more urbanized and industrialized areas, the first stages of economic development result in widening the income inequality gap, as described by the upward-sloping portion of the Kuznets’ curve. At the later stages of development, the industrial gains concentrated in urban areas are eventually shared among more people (decrease in inequality) as the flow of workers moves from rural areas of low-productivity levels into the industrialized metropolis, hence the downward sloping curve.
Kuznets (1958) investigated the parallels between the distribution of income within the United States (for 1919-21, 1929, 1940, 1950 and 1955) and the distribution of income acrosscountries. For each year, the 48 states are divided in 6 groups of 8, sorted by the descending order of per capita personal income as defined by the Department of Commerce 5 . Kuznets also calculated an annual inequality indicator that divides the state-group averages over the national average. In general, Kuznets’ conclusions for U.S. states are very similar to those drawn for international comparisons, although there are two key differences. The first gives emphasis to the level of per capita income inequality, narrower in the United States than that among other nations. The second finds larger amplitude in the sectoral composition in the interstate comparisons than in the international comparisons.
When sub-national regions of the U.S. economy are considered, one should expect them to lie on the decreasing portion of the Kuznets curve, so that the low-income states are associated with greater income disparities than the more developed states. Perloff, Dunn, Lampard and Muth (1960, p. 522) illustrate this point for 1955: “the sixteen states with the lowest per capita income derived some 5.9% of their total manufacturing wages and salaries from ‘machinery (including electrical)’; the sixteen states with middle level income, 16.3%; the sixteen states with the highest per capita incomes, 20.1%.”
Similarly, Williamson (1965) collected U.S. county-level data for 1950 and 1960 (p. 19 and 20), and found that:
‘On the average, the eight lowest income states have a coefficient of inter-county inequality approximately two and one-half times that of the richest seven. The same pattern holds true for the 1960 data, where again severe interregional differentials are associated with relatively low levels of development.’Overall, the inverse-U curve finds some empirical support more at the sub-national than at the international level 6 . But the sub-national studies usually suffer from a lack of data over the long-run, thereby weakening the conclusions for convergence.
Kuznets’ expectations of natural regional convergence are consistent with the neoclassical steady state of conditional convergence 7 across regions, assuming the absence of factors hindering the flows of capital and labor from one place to the other. 8