4.1.2. Midwest

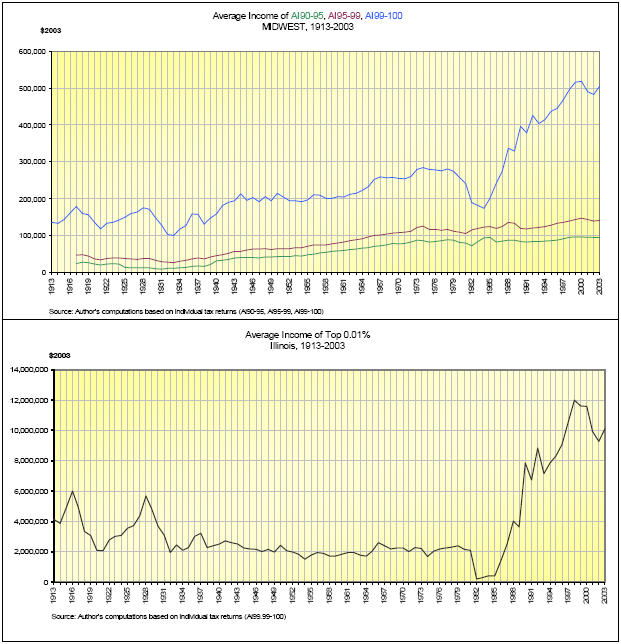
Figure 4.2. Average Income Levels in the Midwest
Occurring in 1982, the sharp drop in income of the top 0.01 percent is hard to explain. Even though the accuracy of the IRS data were affected by a very restricted number of income brackets in the SOI tables that year, the following years still confirm a very pronounced downward trend.