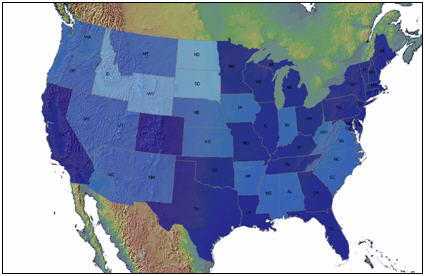
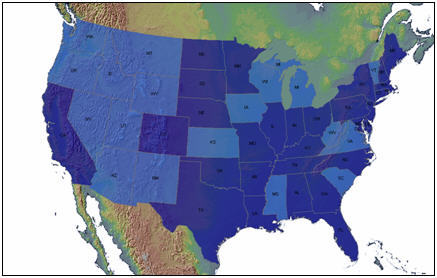
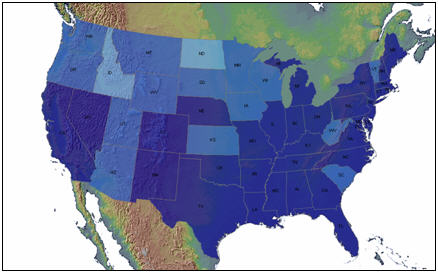
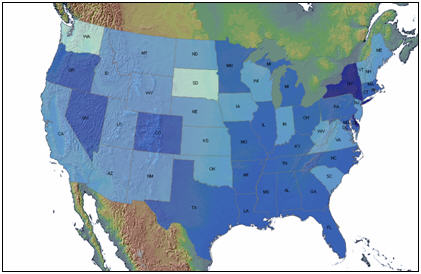
4.2. Within-State Inequality (ytop i,t / ybar i,t)
4.2.1. Maps
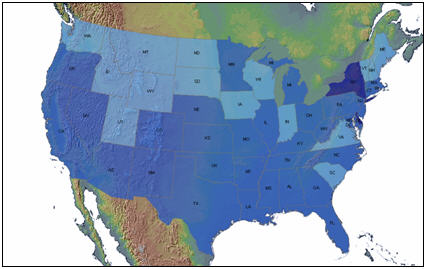
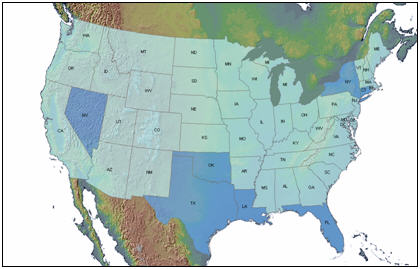
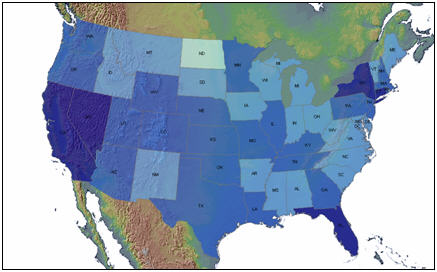
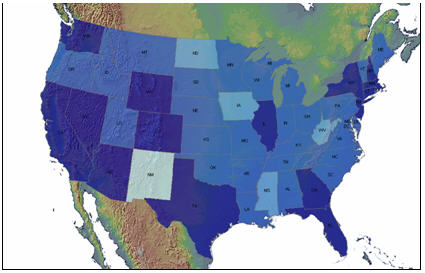
In regard to the upper percentile relative to the state mean, only the results based on the top percentile (AI99-100) are displayed below. Between 1913 and 2003, the values of the intra-state inequality ratio range from 1.4 to 47. For the map of year t to be comparable to the map of any other year n ≠ t, a ranking of the values in four equal intervals is applied to the entire time period (as opposed to the same partition applied to one particular year). 5.9 is the threshold of the first quartile, 7.6 is that of the median, and 9.7 of the third quartile. Hence the same legend for all maps:

Here, the magnitude of the third quartile (75-100 percent) is 37.3 (= 47 – 9.7) and refers to the top percentile. It lies between 3 and 1,833, its equivalent values based on fractiles AI90-95 and AI99.99-100, respectively.
The years selected below (1929-1933, 1939-1945, 1949-1979, 1990, and 2000) represent the beginning or the end of historical events that affected the U.S. economy more or less severely.
