5.3.1. Average Income and Top Percentile Income Decline in Dispersion
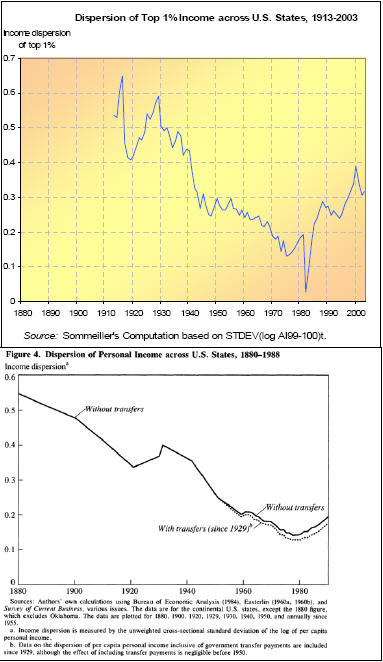
The point here is to compare the income dispersion of the top percentile (AI99-100) with the dispersion of average incomes (σ-convergence). Both dispersion indicators are measured by the unweighted cross-sectional standard deviations of income over time. Barro and Sala-i-Martin’s σ(log yi,t) is based on the log of per capita personal income. Here σ(log ytopi,t) is based on the logarithm of the per household income accruing to the top percentile. The figure below shows two things: 1) similar trends of income dispersion; 2) the income dispersion displays sharper volatility for the top 1 percent income than for the average personal income.
 Figure 5.6. Dispersion between Average and Top Incomes are Alike in Trend
Very sensitive to measurement errors, the issue of income inequality ought to be considered in various ways, and we turn next to the measure of the income dispersion of both average income and the incomes of the 90-99 percent (instead of the 99-100 percent).
5.3.1. Average Income and Top Percentile Income Decline in Dispersion
The point here is to compare the income dispersion of the top percentile (AI99-100) with the dispersion of average incomes (σ-convergence). Both dispersion indicators are measured by the unweighted cross-sectional standard deviations of income over time. Barro and Sala-i-Martin’s σ(log yi,t) is based on the log of per capita personal income. Here σ(log ytopi,t) is based on the logarithm of the per household income accruing to the top percentile. The figure below shows two things: 1) similar trends of income dispersion; 2) the income dispersion displays sharper volatility for the top 1 percent income than for the average personal income.

Very sensitive to measurement errors, the issue of income inequality ought to be considered in various ways, and we turn next to the measure of the income dispersion of both average income and the incomes of the 90-99 percent (instead of the 99-100 percent).