6.1.2. The Case of Crossing Lorenz Curves
Comparison problems arise when two Lorenz curves intersect such as depicted on the graph below (which is also based on hypothetical numbers).
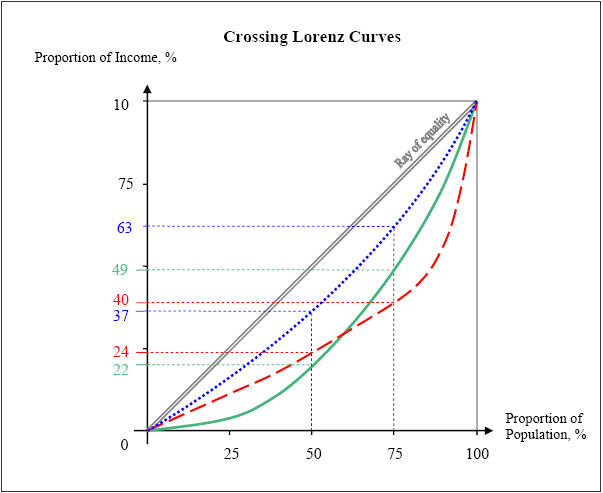
Suppose that the initial income distribution is represented by the dashed line, so that 50 percent of the population earns 24 percent of the national income, and that 75 percent of the households earn 40 percent of total income. If a redistributive policy is implemented to flatten the dashed curve closer to the equality line, two different situations may arise. The first one is the dotted Lorenz curve that respects the principle of transfers, 35 that is, the transfer of income from rich to poor households reduces income inequality and shifts the initial Lorenz curve closer to the diagonal of equity. However, the second outcome might be the solid curve, which violates this principle. On the one hand, looking at the median 36 suggests that the initial distribution (50 percent of the population earning 24 percent of total income) is more equal than post-transfer distribution (50 percent of the households earning 22 percent of overall income). On the other hand, looking at the upper quartile suggests the contrary conclusion (75 percent of the households enjoy a higher income after the tax-transfers). In other words, crossing Lorenz curves introduces an unequivocal bias in any attempt of ranking inequality distributions.
Policy implications are at stake. Non-crossing Lorenz curves are used to justify redistributive policies transferring income from rich to poor individuals. Ideally, such top-to-bottom transfers shift the Lorenz curve inwards, towards the line of equality. However, the case of intersecting Lorenz curves clearly imposes a limit to the ‘rich-to-poor reasoning’ because a consistent ordering of income distributions in terms of inequality is no longer possible. This reveals the complexities of the income inequality phenomena.
With these considerations in mind, we now need to choose which functional form my best approximate the Lorenz curve, before proceeding to the computation of the distribution itself.